1 Introduction
1.1 Design of experiments
Design of Experiments is an integral component of agricultural research. A scientifically designed experiment is a valuable tool in advancement in gaining new knowledge and technology development. “It is the effective use of the tools of statistical design of experiments that paved the way for the green revolution” – these words of the father of green revolution in India, Dr. M.S. Swaminathan, itself shows how important is Design and analysis of experiments as well as statistical science is for agricultural experiments. A carefully designed experiment is able to answer all the queries of a researcher with accuracy and reliability with efficient use of available resources of the experimenters. Thus, for successful experimentation, it is highly desirable that scientists and researchers of scientific disciplines, including agricultural sciences, understand the basic principles of designing an experiment and analysis of resultant data from the completed experiment. It may be emphasized that a researcher should always consult a statistician before, during and after experimentation, if he is not convinced enough about using a design for his experiment or an analysis technique for his data.
Any scientific investigation involves formulation of certain assertions (or hypotheses) whose validity is examined through the data generated from an experiment conducted for the purpose. The term ’experiment’is defined as the systematic procedure carried out under controlled conditions in order to discover an unknown effect, to test or establish a hypothesis, or to illustrate a known effect.
Experiments can be designed in many different ways to collect information. Design of experiments (DOE) is a systematic method to determine the relationship between factors affecting a process and the output of that process. In other words, it is used to find cause-and-effect relationships.
DOE is a structured approach for conducting experiments. Mainly aims at
Validity
Reliability
Replicability
Optimality
1.2 A simple example
Suppose you want to know, which of the 3 organic manures (Poultry manure, Cow-dung, Coir-pith compost) is good for getting high yield.
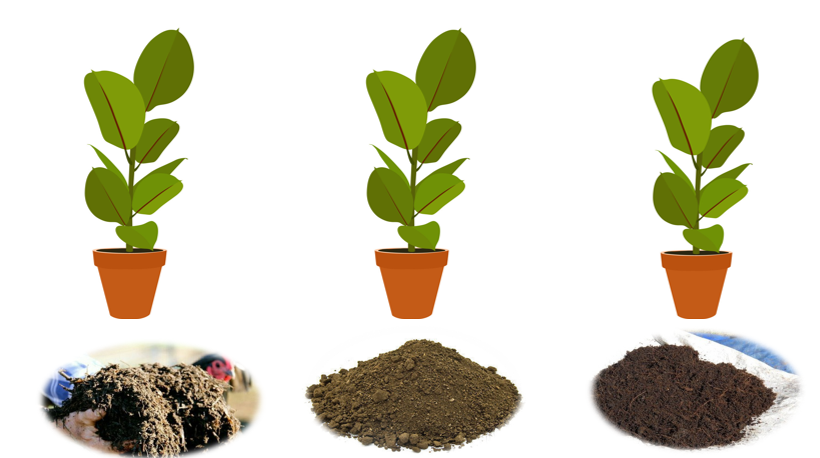
Figure 1.1: Poultry manure, cow dung and coirpith compost
You have decided to conduct an experiment. Consider you as a layman with no knowledge in design of experiments. So, you have selected 3 potted plants for the experiment. 3 organic manures are applied to the potted plants.

Figure 1.2: Treatments given to potted plants as shown

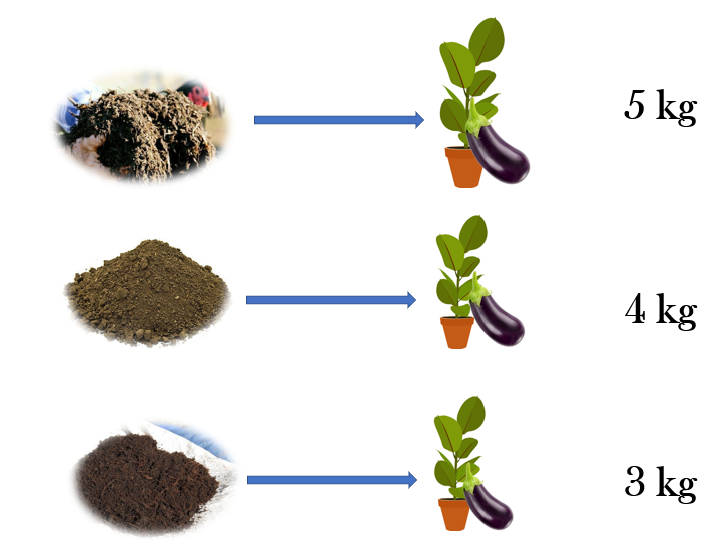
Figure 1.3: Yield observed from the plants
So, based on your experiment, can you say the poultry manure is the best?
What if somebody repeats this experiment somewhere and the results are different?
What about the variance due to experimental error?
What if the experimenter wants to show that poultry manure is the best? So he has allotted healthy plant to poultry manure.
Can an experiment like this has validity?
Can we make a conclusion from this experiment?
Answer to this question gives the importance of proper designing of experiments. Nobody in the scientific fraternity is going to accept your above experiment. Your experiment has validity only if its validity is proved by statistical theories. All these issues can be well taken care off by proper designing of experiments. After discussing the basic principles of design, it will be shown, how the above experiment looks like after proper designing.
Design of experiment means how to design an experiment. In the sense that how the observations or measurements should be obtained to answer a query in a valid, efficient and economical way. The designing of experiment and the analysis of obtained data are inseparable. If the experiment is designed properly keeping in mind the question, then the data generated is valid and proper analysis of data provides the valid statistical inferences. If the experiment is not well designed, the validity of the statistical inferences is questionable and may be invalid.
1.3 Importance of DoE
Reduce, control and provides an estimate of the experimental Error
Gives a structured approach
It reduce cost of experiment with considerable reliability
Produces statistically valid results
Allows to accommodate changes
Reduce complexity
Improves accountability
1.4 Characteristics of a good design
Provides unbiased estimates of the factor effects and associated uncertainties
Enables the experimenter to detect important differences
Includes the plan for analysis and reporting of the results
Gives results that are easy to interpret
Permits conclusions that have wide validity
Minimal resource usage
Is as simple as possible
Statistical design of experiments refers to the process of planning the experiment so that appropriate data will be collected and analyzed by statistical methods, resulting in valid and objective conclusions. The statistical approach to experimental design is necessary if we wish to draw meaningful conclusions from the data. When the problem involves data that are subject to experimental errors, statistical methods are the only objective approach to analysis.
Creation of controlled conditions is the main characteristic feature of experimentation and DOE specifies the nature of control over the operations in experiments. Proper designing ensures that the assumptions required for appropriate interpretations of data are satisfied thus increasing the accuracy and sensitivity of results.
There are two aspects to any experimental problem: the design of the experiment and the statistical analysis of the data. These two subjects are closely related because the method of analysis depends directly on the design employed.

Figure 1.4: DoE and Statistical analysis
1.5 Brief history
The statistical principles underlying design of experiments were pioneered by R. A. Fisher in the 1920s and 1930s at Rothamsted Experimental Station, an agricultural research station around fourty kilometres north of London. Fisher had shown the way on how to draw valid conclusions from field experiments where nuisance variables such as temperature, soil conditions, and rainfall are present. He introduced the concept of analysis of variance (ANOVA) for partitioning the variation present in data (a) due to attributable factors, and (b) due to chance factors. The methodologies he and his colleague Frank Yates developed are now widely used. Their methodologies have a profound impact on agricultural sciences research.
Though the experimental design was initially introduced in an agricultural context, the method has been applied successfully in the industry since the 1940s. George Box and his co-workers developed experimental design procedures for optimizing chemical processes, particularly response surface designs for chemical and process industries.
Recently, experimental designs are also being used in clinical trials. This evolved in the 1960s when medical advances were previously based on unreliable data. For example, doctors used to examine a few patients and publish papers based on such data. The biases resulting from these kinds of studies became known. This led to a move toward making the randomized double-blind clinical trial the standard for approval of any new product, medical device, or procedure. The scientific application of the valid designing and analysis following proper statistical methods became very important in clinical trials.
More recently the experimental design techniques have started gaining popularity in the area of computer-aided design and engineering using computer/simulation models including applications in manufacturing industries.
1.6 Some terms involved
1.6.1 Treatments
The term treatments is used to denote the different objects, methods or processes among which comparison is made. For example, if an experimenter wants to identify which among the objects/methods/process is the best based on an experiment; then this objects/methods/process is called the treatment. More clearly anything that you are about to compare in an experiment is known as the treatment.
Some examples of treatments are different kinds of fertilizer in agronomic experiments, different irrigation methods or levels of irrigation, different fungicides in pest management experiments , doses of different drugs or chemicals in laboratory experiments, different varieties of crops, different pesticides, grazing systems for animals, different tree species in agro-forestry experiments, different concentrations of a solute in chemical experiments etc.
1.6.2 Control
A control treatment is a standard treatment that is used as a baseline or basis of comparison for the other treatments. This control treatment might be the treatment which is currently in use, or it might be a no treatment at all. For example, a study of new pesticides could use a standard pesticide as a control treatment, or an experiment involving fertilizers may have one treatment as no fertilizers at all. In clinical trials, a control treatment is generally a placebo.
1.6.3 Experimental units
Experimental units are the subjects or objects on which the treatments are applied. For example, plots of land receiving fertilizer, groups of animals receiving different feeds, or batches of chemicals receiving different temperatures, pots in glasshouse experiments, Petri dishes or tissues to culture bacteria or micro-organisms in laboratory experiments, etc
1.6.4 Response
Responses are measurable outcomes, which are observed after applying a treatment to an experimental unit. Alternatively, the response is what we measure to find out what happened in the experiment. In an experiment, there may be more than one response. Some examples of responses are grain yield or straw yield, nitrogen content in plants or biomass of plants, quality parameters of the produce, percentage of plants infested by disease, weight gain by animals, etc.
1.6.5 Factors
Factors are the variables whose influence on a response variable is being studied in the experiment. If only one factor is being studied in an experiment then such an experiment is called a single factor experiment. If more than one factor is being studied simultaneously in an experiment, then such an experiment is called multi-factor or factorial experiment. The term factor is commonly used in the case of factorial experiments. For example, temperature and concentration of chemicals in a chemical experiment are two factors, Nitrogen, Phosphorus and Potassium fertilizers are three factors in an agronomic experiment.Dose and time of application of a chemical formulation are two factors in a laboratory experiment.
1.6.6 Factor levels
The term factor levels or a simply levels is used to denote the values or settings that a factor takes in a factorial experiment. For example, doses of a nitrogenous fertilizer as 0 kg/ha, 30 kg/ ha, 80 kg/ha are three levels of the factor fertilizer. 10%, 20%, 30%, 40% concentration of a solute in a solution are four levels of the factor solute in a laboratory experiment. Presence of polythene sheet on the surface of soil or its absence could be two levels of factor management practice in water management study.
1.6.7 Observational Unit
An observational unit is a unit on which the response variables are measured. Observational units are often the same as experimental units, but this may not be true always. The mistake of confusing observational unit with experimental unit leads to pseudo-replication as discussed in a paper by (Hurlbert 1984). Consider an experiment to investigate the effects of ultraviolet (UV) levels on the growth of smolt. The experiment is conducted in two tanks where one tank receives high levels of UV light and the other tank receives no UV light. Fish are placed in each tank and at the end of the experiment growths of the individual fish are measured. In this experiment, the tanks are the experimental units but the observational units are the smolts. The treatments, presence and absence of UV light, are applied to the tanks and not to individual fish but a whole group of fish are simultaneously exposed to the UV radiation. Here any tank effect is completely confounded with the treatment effect and cannot be separated. Another example is that inorganic fertilizers are applied to plots in a field containing some plants. At the time of harvest, all the plants in the plot are not harvested. Only a sample of plants is harvested. In this case once again the plot is the experimental unit to which fertilizers are applied but the observational units are the plants sampled.
1.7 Experimental error
To explain experimental error consider the example given by (Gomez and Gomez 1984).
Consider a plant breeder who wishes to compare the yield of a new rice variety A to that of a standard variety B of known and tested properties. He lays out two plots of equal size, side by side, and sows one to variety A and the other to variety B. Grain yield for each plot is then measured and the variety with higher yield is judged as better. Despite the simplicity and common-sense appeal of the procedure just outlined, it has one important flaw. It presumes that any difference between the yields of the two plots is caused by the varieties and nothing else. This certainly is not true. Even if the same variety were planted on both plots, the yield would differ. Other factors, such as soil fertility, moisture, and damage by insects, diseases, and birds also affect rice yields. Because these other factors affect yields, a satisfactory evaluation of the two varieties must involve a procedure that can separate varietal difference from other sources of variation. That is, the plant breeder must be able to design an experiment that allows him to decide whether the difference observed is caused by varietal difference or by other factors.
The logic behind the decision is simple. Two rice varieties planted in two adjacent plots will be considered different in their yielding ability only if the observed yield difference is larger than that expected, if both plots were planted to the same variety.
Hence, the researcher needs to know not only the yield difference between plots planted to different varieties, but also the yield difference between plots planted to the same variety. The difference among experimental plots treated alike is called experimental error. This error is the primary basis for deciding whether an observed difference is real or just due to chance. Clearly, every experiment must be designed to have a measure of the experimental error.
Response from all experimental units receiving the same treatment may not be same even under similar conditions. These variations in responses may be due to various reasons. Other factors like heterogeneity of soil, climatic factors and genetic differences, etc also may cause variations (known as extraneous factors).
Definition: The variations in response caused by extraneous factors are known as experimental error.
Our aim of designing an experiment will be to minimize the experimental error.
1.8 Basic principles of design
There are three basic principles of designing an experiment namely randomization, replication and local control (blocking).
1.8.1 Randomization
Randomization means random assignment of conditions to study or treatments to the subjects or experimental units. The principle of randomization involves the allocation of treatment to experimental units at random to avoid any bias in the experiment resulting from the influence of some extraneous unknown factor that may affect the experiment.
In the development of analysis of variance (ANOVA), we assume that the errors are random and independent. In turn, the observations also become random through randomization.
The observations are independent and are identically distributed as normal variate is an important assumption in hypothesis testing problems involving test statistics F (Snedecor’s F) and t (Student’s t). This is the major purpose of randomization.
Randomization forms the basis of a valid experiment but replication is also needed for the validity of the experiment. If the randomization process is such that every experimental unit has an equal chance of receiving each treatment, it is called complete randomization.
Consider an example where suppose you want to randomly allot 3 treatments to 3 experimental units. How will you do this? It is very easy; just label all the units from 1 to 3. Make a lot of equal size labelling 1,2 and 3. Put these labels in a bowl pick it with eyes closed. Now if 1 comes; first treatment is alloted to 1st unit. This is a very simple technique of randomization. Random number tables or computer generated random numbers can also be used.

Figure 1.5: Taking a lot from a bowl is also a procees of randomization
1.8.2 Replication
In the replication principle, any treatment is repeated a number of times to obtain a valid and more reliable estimate than which is possible with one observation only. Replication provides an efficient way of increasing the precision of an experiment. The precision increases with the increase in the number of observations. Replication provides more observations when the same treatment is used, so it increases precision.
Replication enables the experimenter to obtain a valid estimate of the experimental error. Estimate of experimental error permits statistical inference; for example, performing tests of significance or obtaining confidence interval, etc. If there is no replication, then the researcher would not be able to estimate the experimental error. And as will be seen in the later Chapters, it is against this estimated experimental error the null hypotheses are tested.
Consider an example where two chemicals A and B are applied to a crop. The interest of study is to see how chemical influences the yield of the crop. In the experiment, there are four plots available and chemical A and B are applied to two plots each randomly as shown in Figure 1.6. The plots receiving the same chemical is expected to give the same response. Here each treatment is repeated 2 times; so, replication is 2. The difference gives the experimental error.
Figure 1.6: Treatments alloted to four plots, replication of each treatment is 2
The results from the experiment is shown Figure 1.7. The yield in kg per plot is given in bracket.

Figure 1.7: The yield in kg per plot is given in bracket
In the experiment, the experimental error can be estimated as \(\frac{\left( 6 - 8 \right)^{2} + {(5 - 4)}^{2}}{2} = \frac{4 + 1}{2} = 2.5\); here the denominator 2 is the number of replications.
This can be also calculated as the square of difference of observation from corresponding treatment mean, here the mean of A is \(\frac{6 + 8}{2} = 7\); the mean of B is \(\frac{5 + 4}{2} = 4.5\). The sum of the square of difference of each observation from treatment mean is taken as shown below \(\left( 6 - 7 \right)^{2} + \left( 8 - 7 \right)^{2} + \ \left( 5 - 4.5 \right)^{2} + \ {(4 - 4.5)}^{2} = 2.5\)
Thus, replication helps to estimate experimental error. Increasing the size of the experiment or increasing the replication also helps to increase the precision of estimating the pairwise differences among the treatment effects. . Replication provides an efficient way of increasing the precision of an experiment. The precision increases with the increase in the number of observations. Replication provides more observations when the same treatment is used, so it increases precision.
1.8.3 Local control (error control)
A good experiment incorporates all possible means of minimizing the experimental error; because ability to detect experimental error increases as the size of experimental error decreases. By putting experimental units that are as similar as possible together in the same group (commonly referred to as a block) and by assigning all treatments into each block separately and independently, variation among blocks can be measured and removed from experimental error. In field experiments where substantial variation within an experimental field can be expected, significant reduction in experimental error is usually achieved with the use of proper blocking.
The replication is used with local control to reduce the experimental error. For example, if the experimental units are divided into different groups such that they are homogeneous within the blocks, then the variation among the blocks is eliminated and ideally, the error component will contain the variation due to the treatments only. This will, in turn, increase the efficiency.
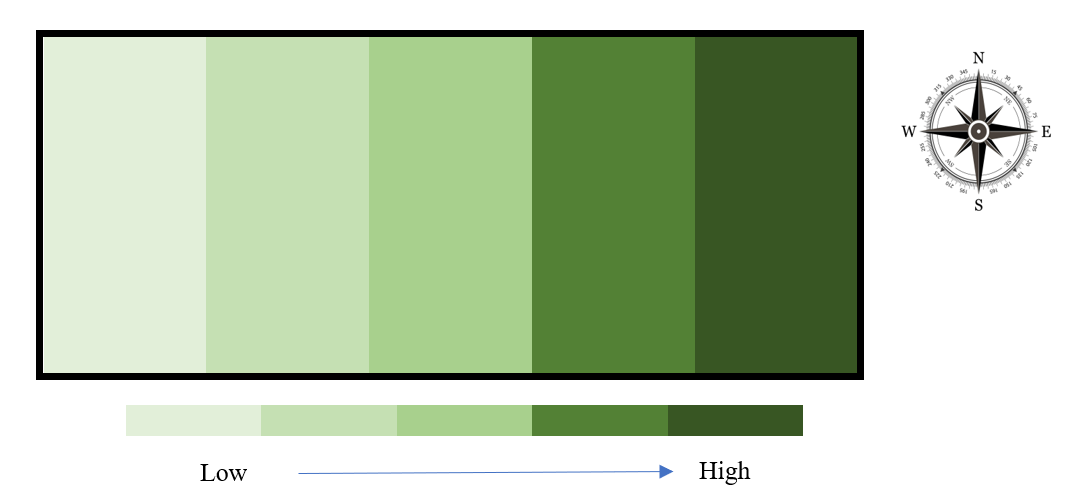
You have a field experiment with 4 treatments and 5 replications. Consider a field with fertility gradient from left to right as shown in figure 1.8.

Figure 1.8: A field with fertility gradient from left to right
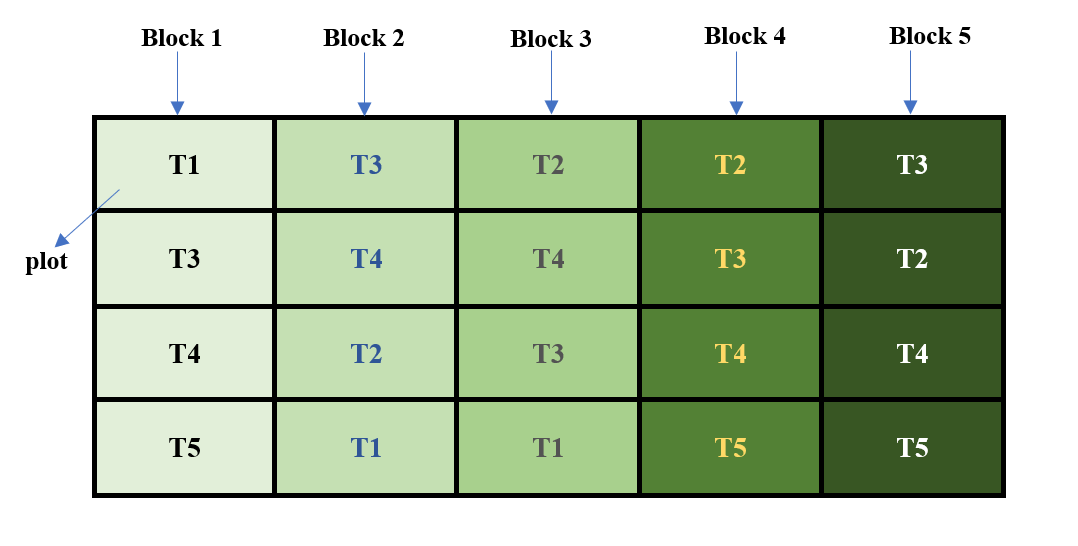
Homogeneity can be achieved by dividing the field in to groups as shown in figure 1.9. Now each vertical strips can be considered as a block. Plots are formed with in each block, where each treatment is allotted randomly. Here randomization is performed with in blocks. You can see that in this example replication is equal to number of blocks, which is equal to 5. Randomization is achieved with in blocks. Local control is achieved by grouping treatments in homogeneous blocks, where fertilizer gradient is same. This is a typical example of Randomized Block Design (RBD), which will be discussed in chapter

Figure 1.9: A field with fertility gradient from left to right
1.9 Other methods of error control
1.9.1 Proper Plot Technique
It is essential that all other factors, which are not treatments should be maintained uniformly for all experimental units. For example, in field experiments, it is required that all other factors such as soil nutrients, solar energy, plant population, pest incidence, and an almost infinite number of other environmental factors are maintained uniformly for all plots in the experiment. This requirement is impossible to satisfy, however to ensure that variability among experimental plots is minimum, some important sources of variability are taken care off using a good plot technique. For field experiments with crops, some important sources of variability considered among plots treated alike are soil heterogeneity, competition effects, and mechanical errors.
1.9.2 Data Analysis
Proper choice of data analysis helps in controlling error, where blocking is not so effective. Covariance analysis is most commonly used for this purpose. By measuring one or more covariates- the characters whose functional relationships to the character of primary interest are known, the analysis of covariance (ANCOVA) can reduce the variability among experimental units by adjusting their values to a common value of the covariates.
For example, in an animal feeding trial, the initial weight of the animals usually differs. Using this initial weight as the covariate, final weight after the animals are subjected to various feeds (i.e., treatments) can be adjusted to the values that would have been attained had all experimental animals started with the same body weight. Or, in a rice field experiment where rats damaged some of the test plots, covariance analysis with rat damage as the covariate can adjust plot yields to the levels that they should have been with no rat damage in any plot.